The Future Is Now
Geographical Information Systems is the Techy, Futuristic Answer to So Many Questions
TWO YEARS, FOUR MONTHS, AND TEN DAYS to map about 4,162 miles of territory: Lewis and Clark’s Expedition to explore the Pacific Northwest and the vast territory acquired by the Louisiana Purchase began on May 14, 1804 and ended over two years later on September 23, 1806. Two centuries later now, today’s GIS specialists could do the job in one day without ever leaving their desks.
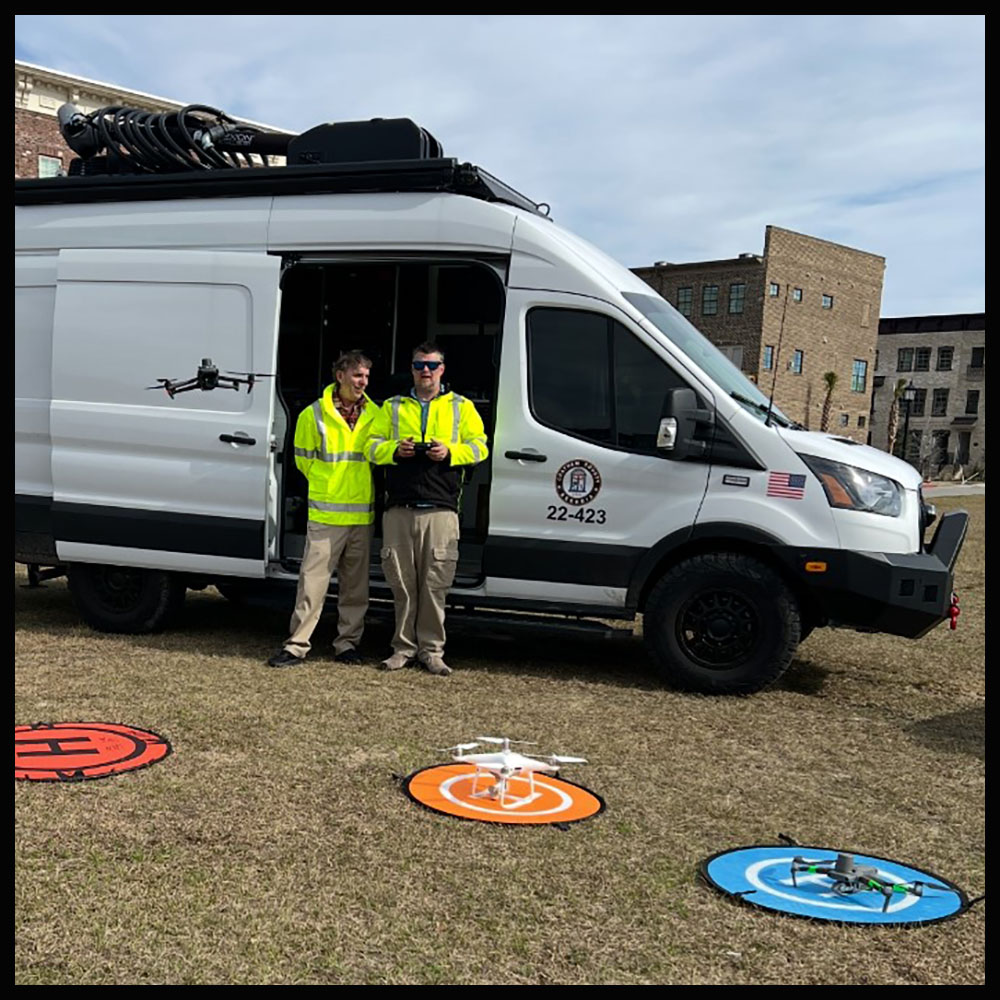 At the most elementary level, Geographic Information Systems (GIS) is all about maps – all kinds of maps. GIS technology refers to the process of storing, retrieving, manipulation, analysis, display, and constant maintenance of geographic datasets and other data. Collected data such as Drone Imagery, GPS Coordinates, Lidar Points and Plats, and As-builts are translated into visual, spatial maps to provide context that helps us understand it all. It requires computing technology, software, and technical expertise.
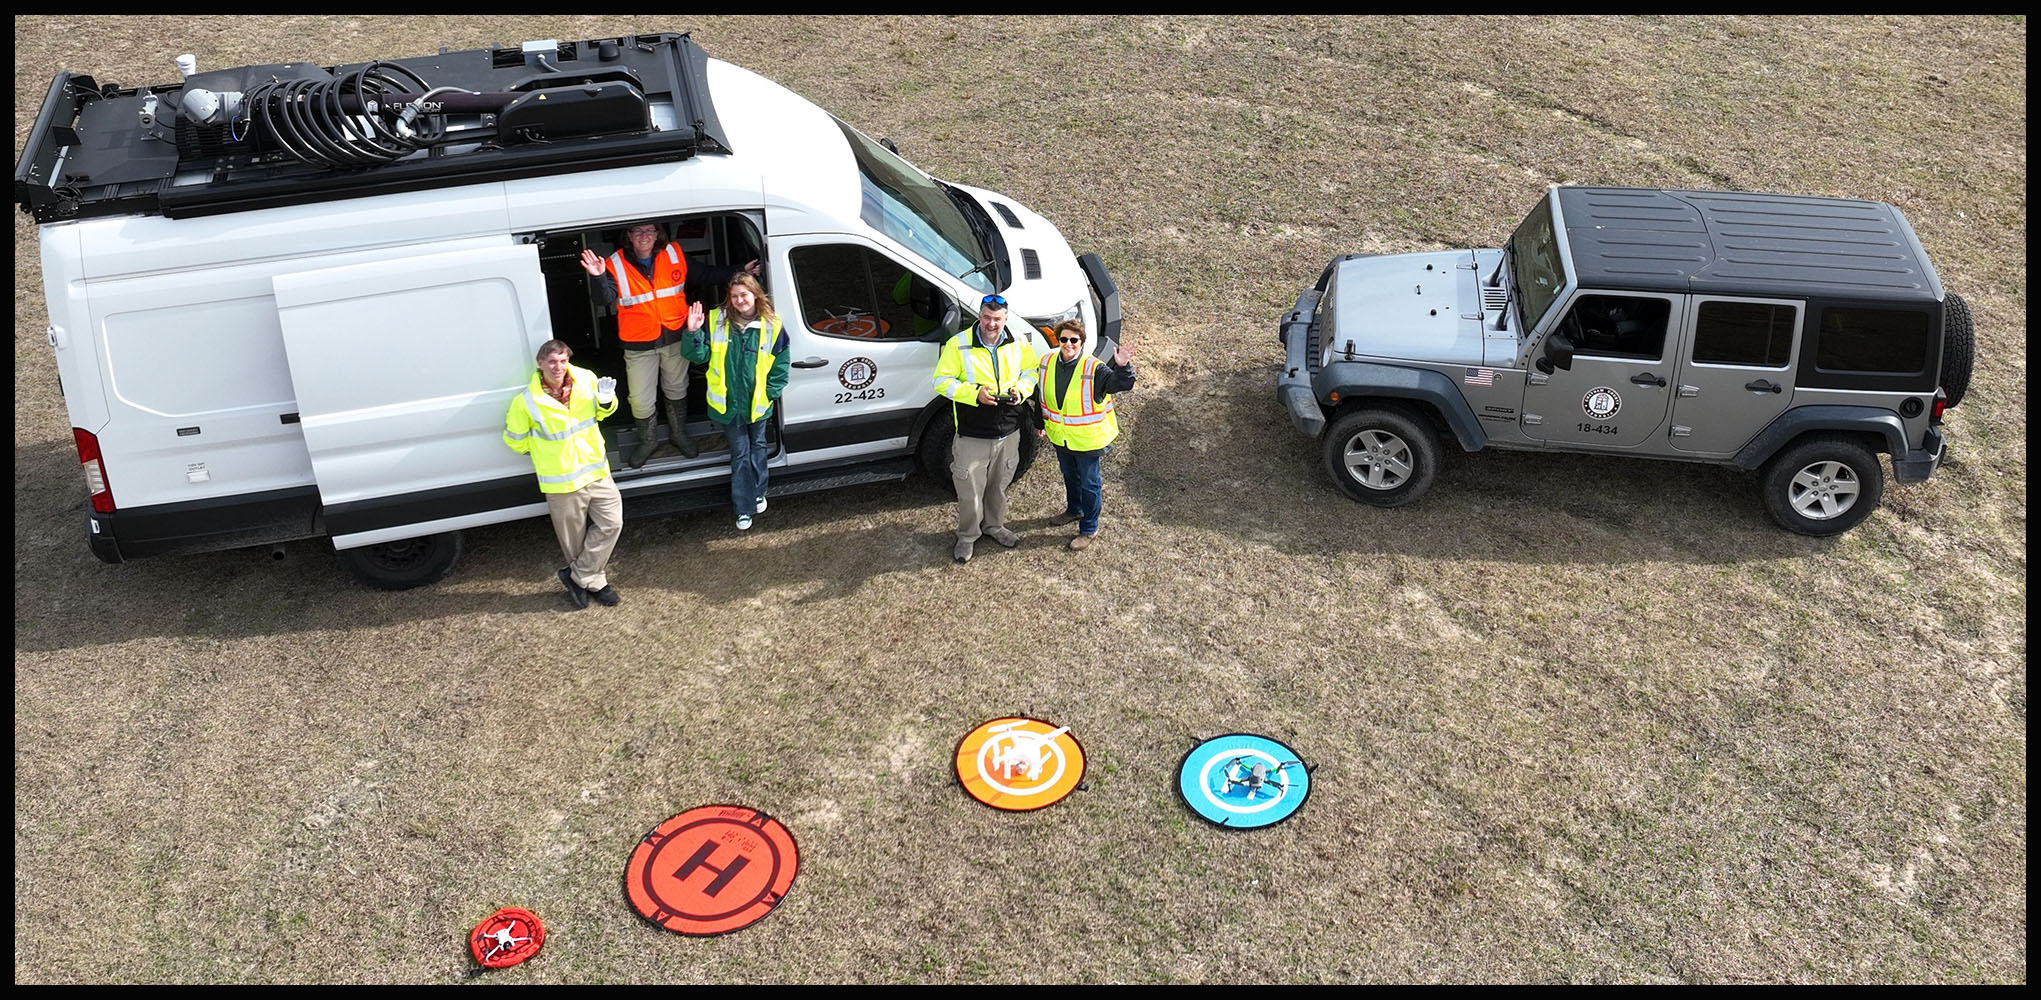
Team Chatham’s GIS experts compile and interpret both historic and real-time data for multiple departments and multiple applications in the service of our community. Law Enforcement, for example, uses GIS-provided GPS capabilities for tracking and for expedited responses. Fire Stations may use GIS to know the size of every building within their area of responsibility, so they can know in advance what size trucks and crews to send when needed. GIS helps provide information to determine property taxes and election districts. It helps Mosquito Control know where and when to spray and Public Works know where different types of maintenance is needed. GIS is nothing short of amazing.
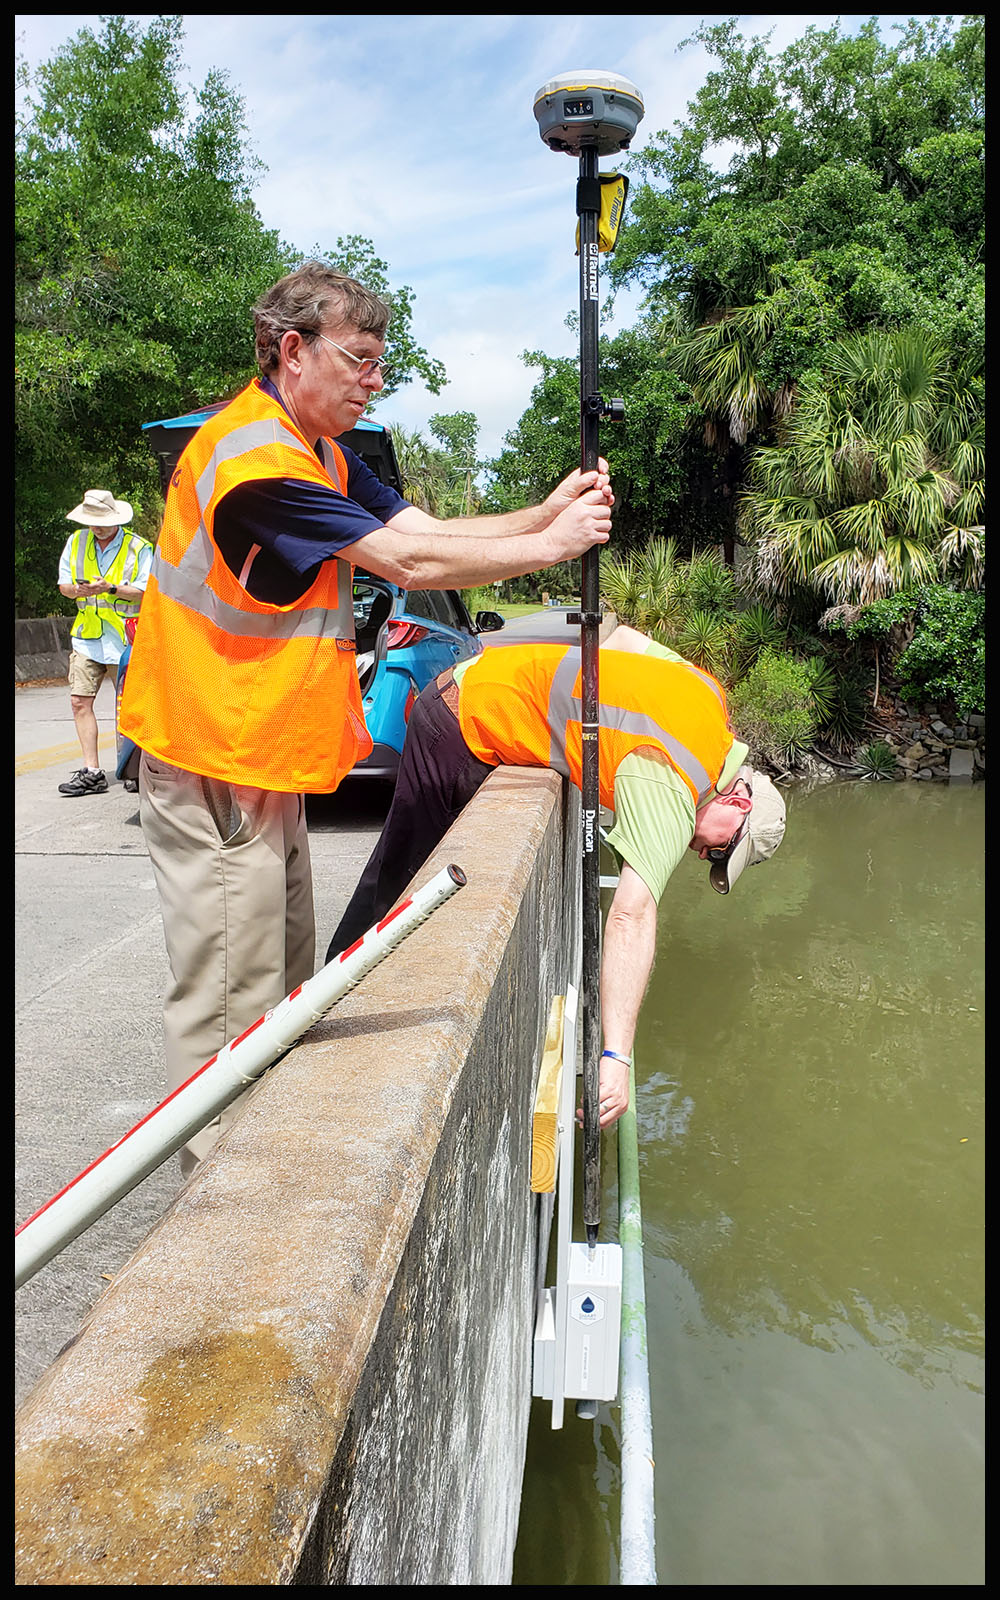 Chatham Department of Engineering has a half-dozen highly-skilled GIS experts on staff. With an arsenal of high-tech tools that would make Inspector Gadget jealous, they use futuristic means to answer today’s questions so we can be prepared for tomorrow. Where will we need new or improved roads? How high can waters rise under a certain bridge before it fails and floats off its foundations? Where are the original boundary markers of an area, and how do assorted and divergent historical records add up to verify who owns and is responsible for a property easement or a canal? What’s the elevation of a property zoned for development, and what would it take to keep it from flooding? How do higher tides affect our tree canopy by changing the salinity of certain areas, making them incompatible with tree life? Where can resources be deployed most effectively during emergencies for the benefit of the greatest number of residents?
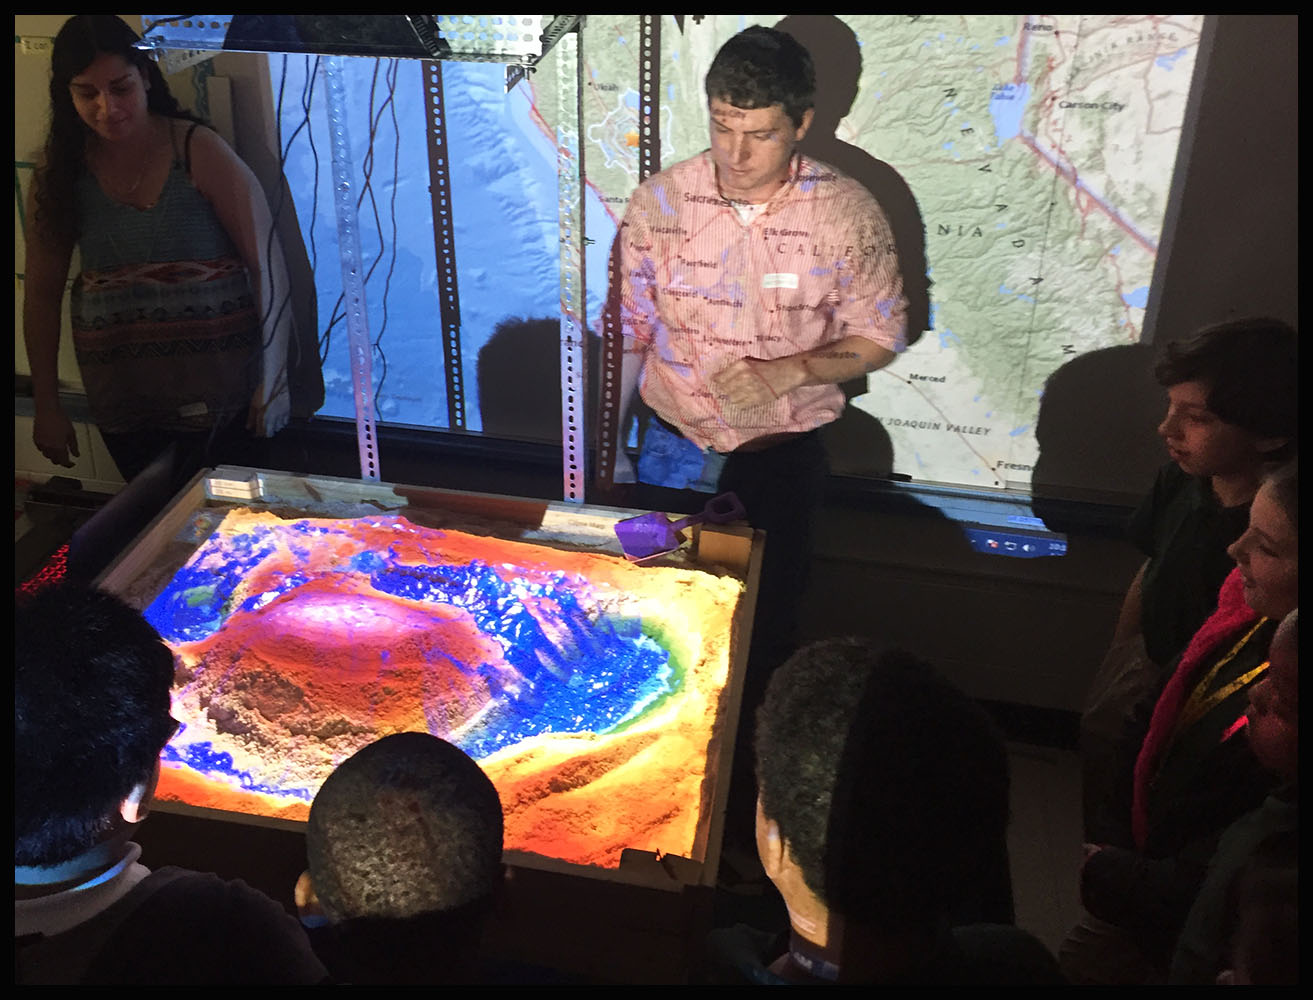
Any type of data that can be compiled can be expressed visually as some kind of map using GIS. Chloropleth Maps express quantities of anything from rainfall to crime to new construction by painting the areas where they occur in correlated shades of a color to show more or less occurrence. Heat Maps can express the density of things (such as population or new businesses or outbreaks of the flu) or their intensity (of things like a horticultural blight or earthquakes or voter turn-out) using a spectrum of colors to show where greater or lesser saturations have been observed. Isolene Maps pick out points with common features (like geographic elevation or average temperatures or wildlife habitats) and connect those points into continuous lines of demarcation.
The maps take lists of individual pieces of data and make them make sense. They make information more easily digestible, and they can be layered, one map overlayed on top of another, to produce tremendously nuanced pictures of whatever is being studied. Did you know, for instance, that data obtained in Lewis and Clark’s day would need to be tweaked slightly in our day to allow for the continual shifting of the Earth’s magnetic poles? With GIS those two different records could be overlayed and compared, studied for more precise understanding of the original or adjusted for current application.
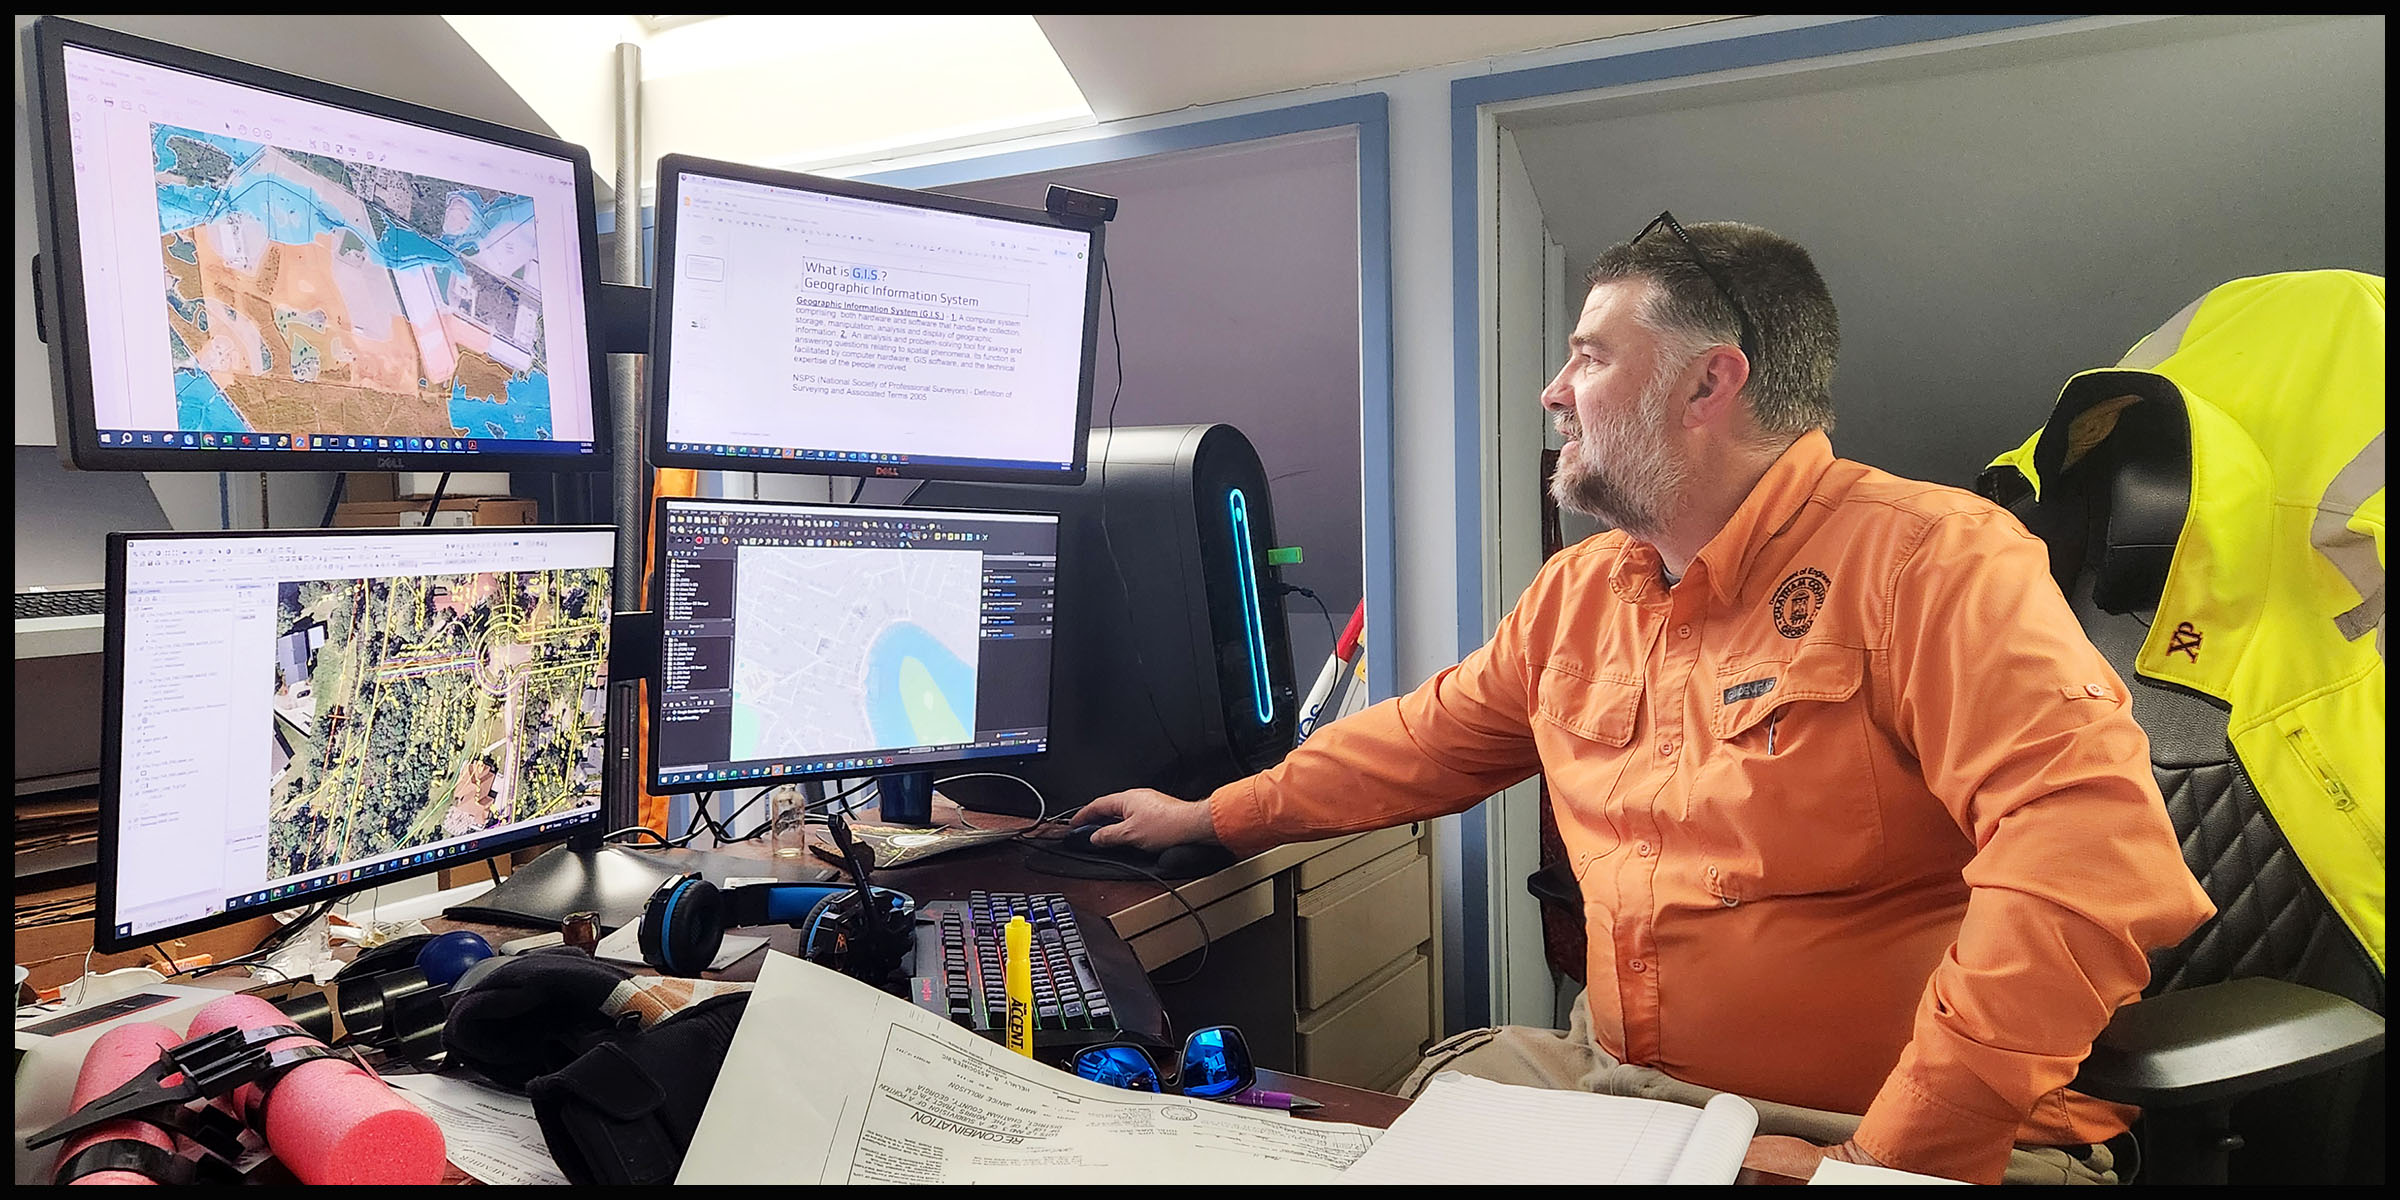
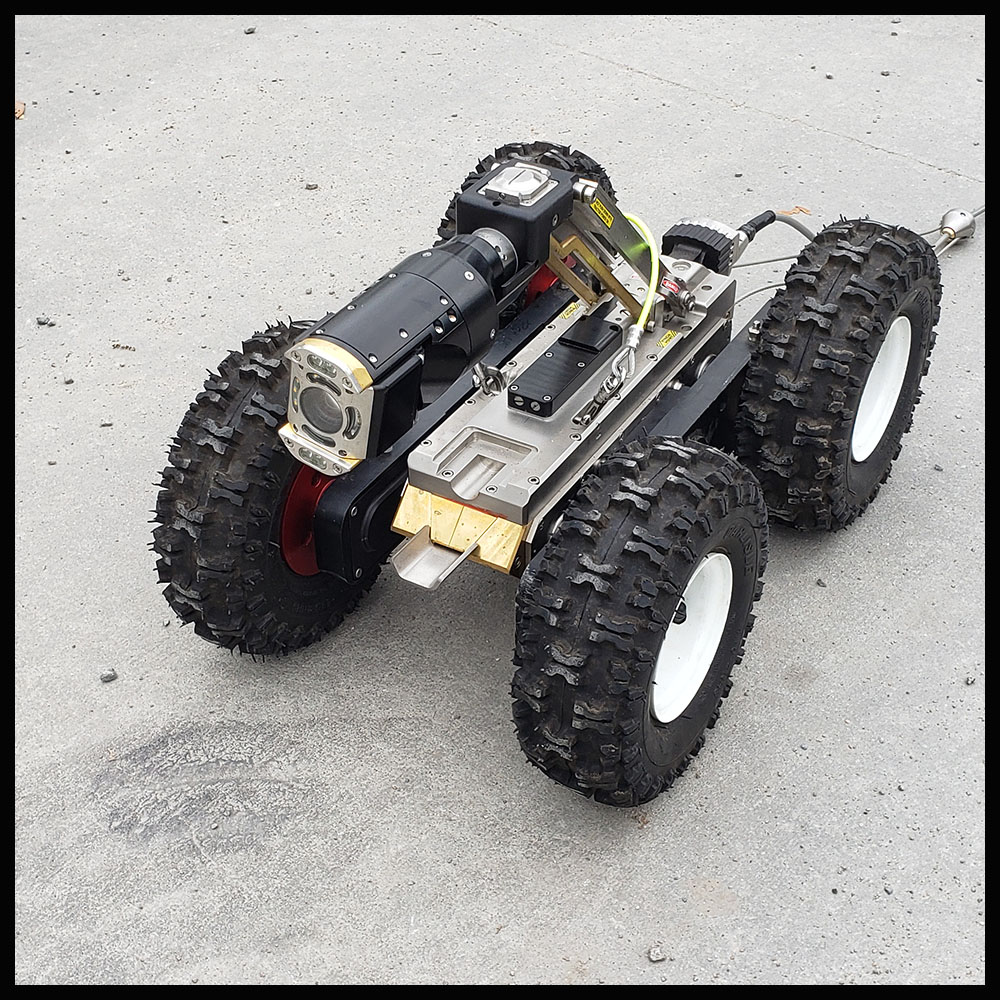 “I’ve been drawing maps on paper since I was four years old.” David Anderson, GIS Manager with Chatham County’s Department of Engineering, now uses drones, lasers, subterranean scopes, and even robots to obtain some of the raw data that he translates into digital maps. He and his GIS team members used their powers for good in the Emergency Operations Center during all three of the major storms that impacted our area during this recent hurricane season. They worked around the clock to constantly acquire and process the most current information about impassable roads and compromised bridges, flooded neighborhoods, projected storm surges, displaced residents, and available resources. The perspective and discernment that their GIS maps provided allowed all the other emergency teams to work efficiently and effectively to take the best possible care of our community.
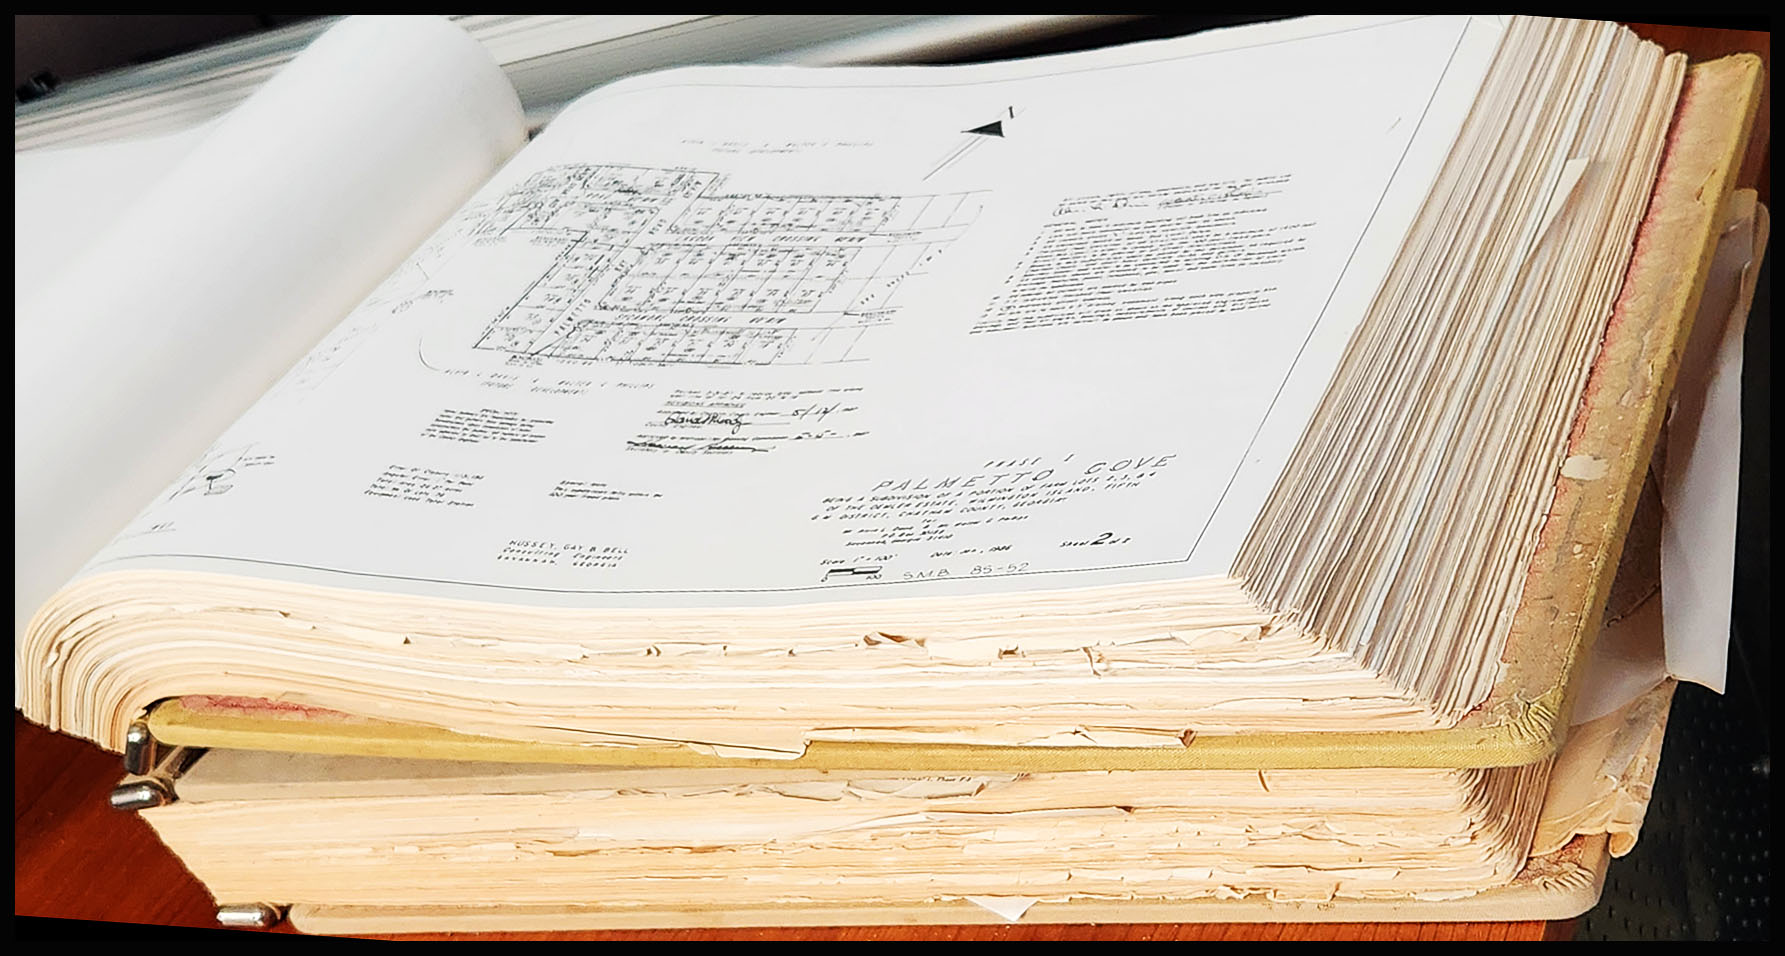
Information that used to be stored in bound books too heavy to lift now can be accessed by GIS specialists anywhere with a few strokes of a keyboard. Data that used to take months or years to acquire now might be produced overnight or sooner. The future of GIS will be Geo-AI powered to provide real-time maps on demand -- to allow firefighters, for instance, to monitor a spreading wildfire as it moves and know where best to attack it. For Team Chatham’s GIS specialists, who were once kids drawing maps and dreaming of a future that included robots and lasers and computers and coded maps, that future is now, and they are the cutting-edge mapping scientists making it real.